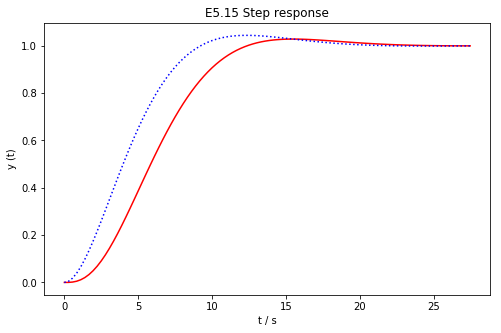
E5.15
Code
import matplotlib.pyplot as plt
import control as ctl

sys1 = ctl.tf([500], [1, 20, 150, 500])
sys2 = ctl.tf([50], [1, 10, 50])

t1, y1 = ctl.step_response(sys1)
t2, y2 = ctl.step_response(sys2)

plt.figure(figsize=(8, 5))
plt.plot(t, y1, 'red')
plt.plot(t, y2, 'b:')
plt.xlabel('t / s')
plt.ylabel('y (t)')
plt.title('E5.15 Step response')
plt.show()
Image
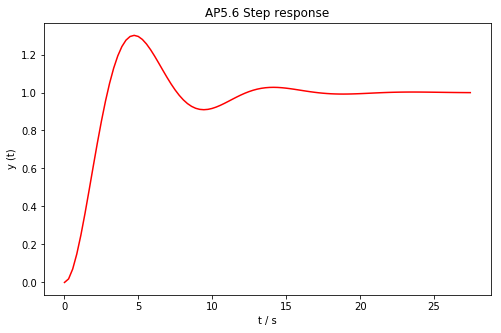
AP5.6
Code
Step response
import matplotlib.pyplot as plt
import control as ctl

sys = ctl.tf([0.51], [1, 0.51, 0.51])

t, y = ctl.step_response(sys)

plt.figure(figsize=(8, 5))
plt.plot(t, x2, 'r')
plt.xlabel('t / s')
plt.ylabel('y (t)')
plt.title('AP5.6 Step response')
plt.show()
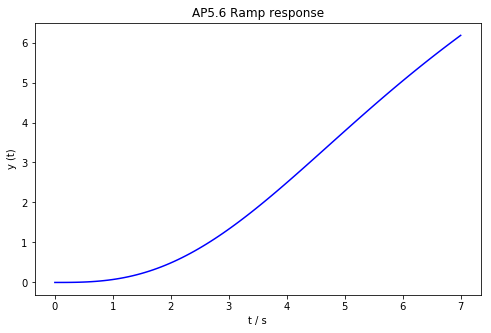
Ramp response
import matplotlib.pyplot as plt
import control as ctl

sys = ctl.tf([0.51], [1, 0.51, 0.51, 0])

t, y = ctl.step_response(sys)

plt.figure(figsize=(8, 5))
plt.plot(t, y, 'b')
plt.xlabel('t / s')
plt.ylabel('y (t)')
plt.title('AP5.6 Ramp response')
plt.show()
Image
Step response
Ramp response